

1. Introduction: From the Result to the Process
The first part of this series dealt with the main view — the juxtaposition of two answers as a didactic stage. It answers a yes-or-no question, and it answers it convincingly: the attached server makes a visible difference. Yet it is silent about how that difference comes about. Which tools the model chooses and in what order, with which arguments it calls them, how their results flow back into the ongoing dialogue, and at which point several runs finally become a coherent recommendation — all of this runs hidden in automatic operation. The running timeline of the main view hints at the traffic but does not halt it.
It is precisely here that the present second part begins. It deals with the
step-by-step view, a view of its own under the route mcp-walkthrough with the
title “MCP Server — Step by Step”. Where the main view sets the result of two
requests side by side and thereby conceals the mechanism, the step-by-step view
reverses the relationship. It halts the pipeline, makes each phase individually
triggerable, and turns the otherwise fleeting course into a legible, temporally
ordered object. The didactic gain lies in slowing down: what the main view reels
off in one go, the walkthrough view decomposes into comprehensible steps that the
viewer can walk through at his own pace.
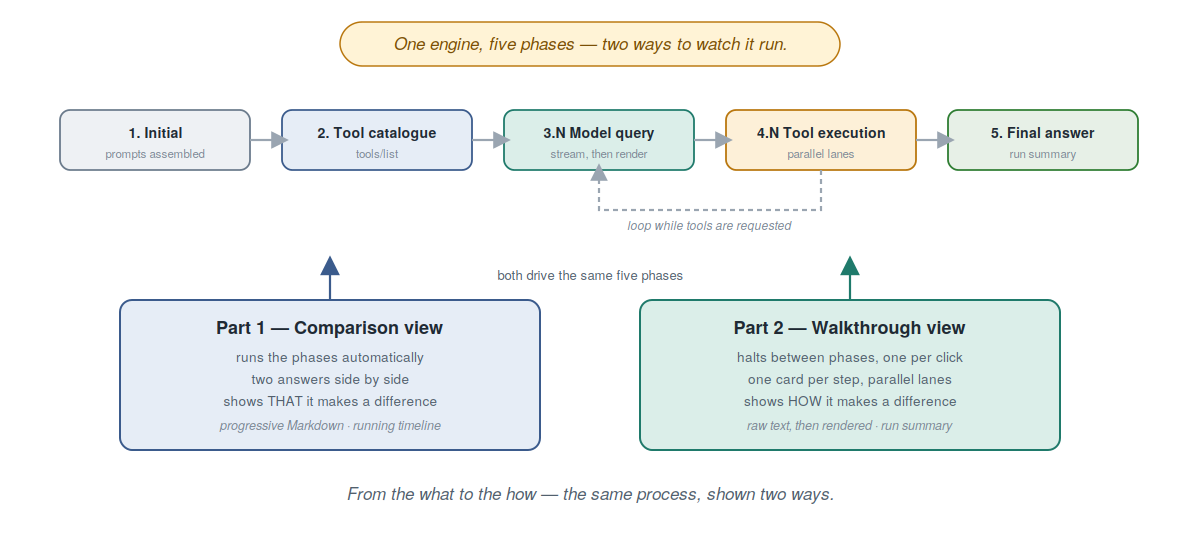
The tour of this part therefore no longer follows the constituents of an interface, but the hurdles that halting and making visible an inherently automatic process brings with it. The first and load-bearing chapter treats the architectural precondition: the decomposition of the automatic tool loop into individual, resumable phases that both views share. There follow the processing track as a timeline, the individual triggering of the phases, the data panel beside the track, the presentation of parallel tool calls, and the streaming and rendering within a single phase card. A concluding chapter brings both parts of the series together.
As in the first part, general familiarity with Vaadin is assumed; particular elements are presented in detail as to their effect. The technical basis matches that of the first part: JDK 26, Vaadin Flow 25.1.6 with embedded Jetty 12.1.10 and Jackson for JSON processing, without Spring and without Jakarta EE. Both views rest on the same protocol logic and differ solely in their drive and in their presentation — a fact that the following chapter takes as its point of departure.
2. From the Automatic Loop to the Halted Pipeline
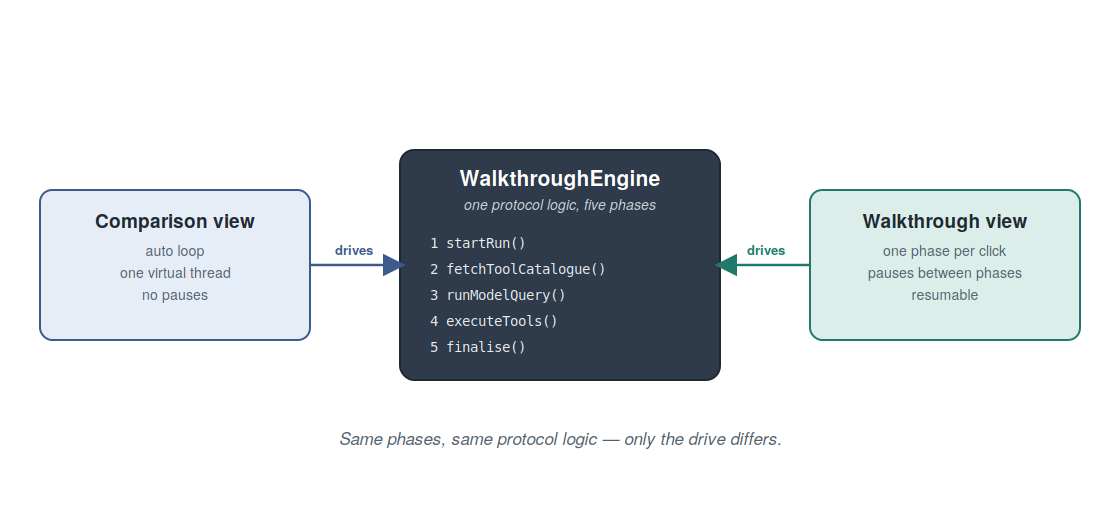
The step-by-step view and the main view show the same process. This is not an assertion but an architectural fact, and it is the precondition for everything else this part treats. The main view drives the tool loop automatically: it calls the model, executes the requested tools, adds their results to the dialogue and calls the model again, until no further tools are requested. The walkthrough view must halt precisely this loop and decompose it into individually triggerable steps — without the protocol logic being duplicated. Were it duplicated, the two views might show two different courses; yet the didactic value of the walkthrough rests on its showing the same course, merely slowed down.
The solution lies in a dedicated bearer of the protocol logic, the
WalkthroughEngine. Each of its methods runs exactly one phase, mutates the
supplied state and returns the result as a phase record that the interface can
render.
/** Phase 1. Build a fresh state seeded with the system + user message. */
public WalkthroughState startRun(String systemPrompt, String userMessage) {
    return new WalkthroughState(systemPrompt, userMessage);
}

/** Phase 2. Fetch the MCP tool catalogue and attach it to the state. */
public WalkthroughPhase.ToolCatalog fetchToolCatalogue(WalkthroughState state) {
    ArrayNode tools = toolBridge.toolsForOllama();
    state.setToolsArray(tools);
    List<String> names = new ArrayList<>(tools.size());
    for (JsonNode tool : tools) {
        String name = tool.path("function").path("name").asText(null);
        if (name != null) names.add(name);
    }
    WalkthroughPhase.ToolCatalog phase = new WalkthroughPhase.ToolCatalog(names, tools);
    state.setCurrentPhase(phase);
    return phase;
}
The decisive thought stands in the engine’s class comment: the protocol logic
resides in a single place, and only the drive differs. The class comment puts it
thus: “The engine is shared by the comparison view (driving the phases in an auto
loop) and the walkthrough view (driving them one user click at a time); the
protocol logic therefore lives in a single place.” The five phases are realised as
methods — startRun, fetchToolCatalogue, runModelQuery, executeTools and
finalise — and each is callable on its own. It is precisely because each phase is
a method that the walkthrough view can call them individually on a button press,
while the main view reels them off in a single loop on one virtual thread.
So that the interface can render each phase uniformly, the phase results are modelled as a sealed interface. Each record carries the partial result the walkthrough view is to show and at the same time names the action that advances to the following phase.
public sealed interface WalkthroughPhase
        permits WalkthroughPhase.Initial,
                WalkthroughPhase.ToolCatalog,
                WalkthroughPhase.ModelQuery,
                WalkthroughPhase.ToolExecution,
                WalkthroughPhase.FinalAnswer {

    /** Short title of the phase, shown as the card heading. */
    String title();

    /** Plain-English description of what just happened. */
    String description();

    /** Label of the button that advances to the next phase. */
    String nextActionLabel();

    /** True when this phase is the last one; the run is complete. */
    default boolean terminal() {
        return false;
    }
The sealed interface finally names its five permitted forms. Each is realised as a
record and knows three pieces of information: a title for the card heading, a
description of what has just happened, and the label of the button that leads to
the next phase. Each phase thus carries its own rendering instruction with it; the
interface need not know which phase it is in, but asks the record for title,
description and next action. The last phase reports through terminal that the run
is complete.
The course of the phases can be read as a state machine. The first two phases occur once each; between the model query and the tool execution runs a loop that is repeated until the model requests no further tools; then the run issues into the final answer.
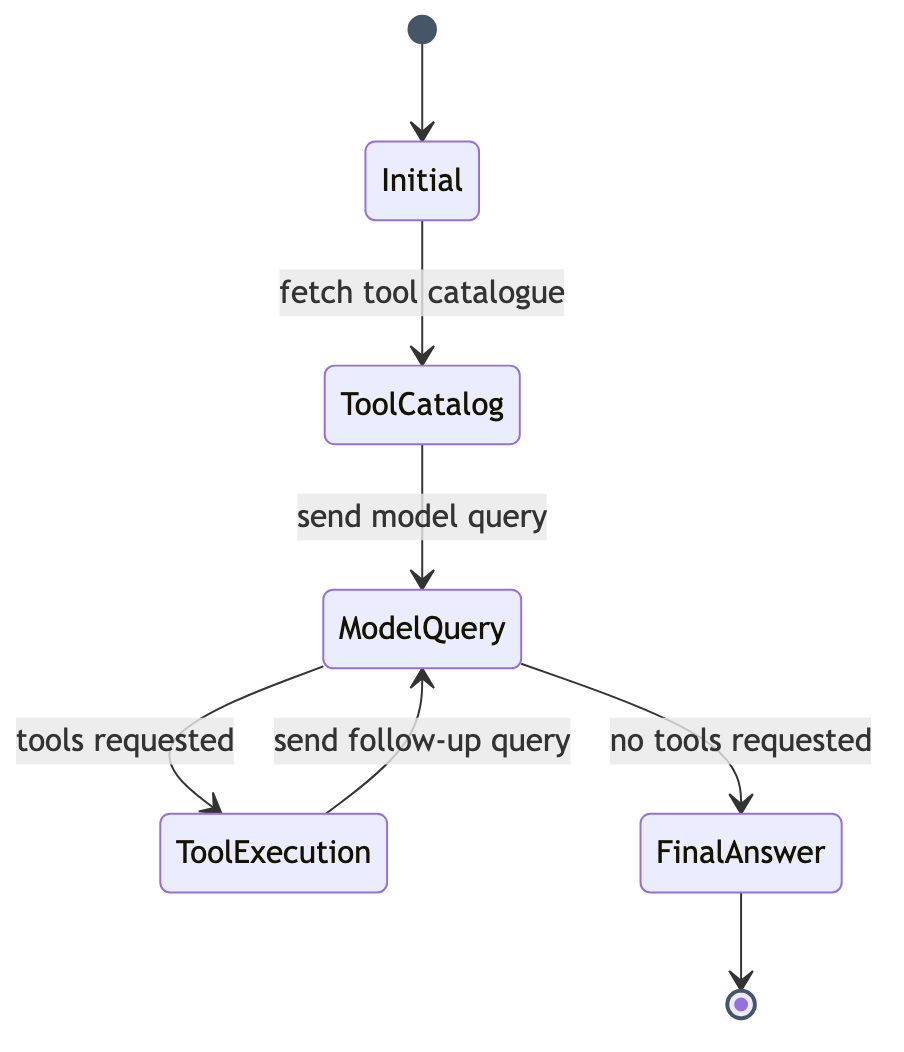
It is on this very state machine that both views rest. The main view traverses it of its own accord, without pause; the walkthrough view pauses at each transition and leaves the next step to the viewer. Which drive is at work is a property of the view, not of the engine.
The decomposition into resumable phases is thus far more than a structural convenience. It is the guarantee that the slowed-down presentation of the walkthrough view does not show a reconstructed imitation of the course, but the course itself — the same one that the main view reels off in a single go. On this foundation the following chapter can show how the individual phases become a growing track.
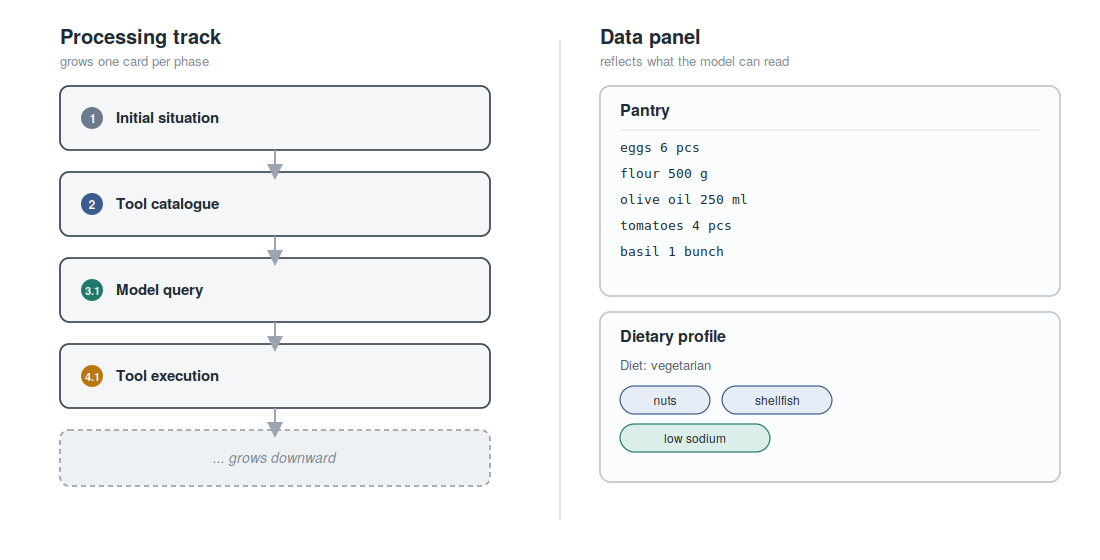
3. The Processing Track as a Timeline
Where the main view shows only the final result, the walkthrough view preserves the entire path to it. The central visual element in which this path becomes visible is the processing track: a vertical sequence of cards that grows by one card with every completed phase. The track is thus not merely a display element but the actual record of the process — a record the viewer can read in retrospect, because it persists rather than flowing away like the stream of the main view.
The bearer of the track is a plain container that takes up a card for each phase. It arises when the view is assembled, beside the data panel.
public WalkthroughView() {
    addClassName("recipe-shell");
    addClassName("recipe-walkthrough");
    setSizeFull();

    Div body = new Div(buildTrack(), dataPanel);
    body.addClassName("recipe-body");
    body.setSizeFull();
    add(body);

    configureControls();
}
The left half of the body forms the track, the right half the data panel, to which
a chapter of its own is devoted. Within the track a trackContainer collects the
cards. Each phase has its own build method that creates a card and appends it to the
container. The first phase, the initial situation, shows the pattern in its purest
form.
private void renderInitialCard(WalkthroughPhase.Initial phase, Runnable onNext) {
    Div card = newCard(null, "recipe-card--initial");
    Span chip = makeChip("recipe-chip--initial", VaadinIcon.FLAG_O, phase.title());
    Div header = headerRow(chip);
    Span subtitle = makeSubtitle(
            "Conversation context, ready to be sent. Nothing has hit the model yet.");
    Div result = new Div();
    result.addClassName("recipe-card__result");
    result.add(makeSection("System prompt", phase.systemPrompt()));
    result.add(makeSection("User message", phase.userMessage()));
    Div description = makeDescriptionBlock(phase.description());
    card.add(header, subtitle, result, description);
    trackContainer.add(card);
    addNextButton(card, phase.nextActionLabel(), onNext);
}
Every card follows the same construction: a header row with an icon belonging to the
phase and the title, a subtitle, a result area with the respective content of the
phase, and a description of what has happened. Title, description and the label of
the next action come directly from the phase record — those very pieces of
information that the previous chapter showed on the sealed interface. The card
therefore need not know which phase it renders; it asks the record. Finally,
trackContainer.add appends the card to the track, and addNextButton furnishes it
with a button that leads to the next phase.
The order of the cards is not arbitrary but carries meaning. Cards stacked one above
another denote a sequential dependency: one phase follows from the previous. Between
consecutive cards a connector drawn purely via CSS is therefore shown — a line with
an arrowhead that makes the flow visible at a glance. These connectors are not part
of the Java source but are drawn in the stylesheet through the pseudo-elements
::before and ::after; the cards themselves thereby remain plain.
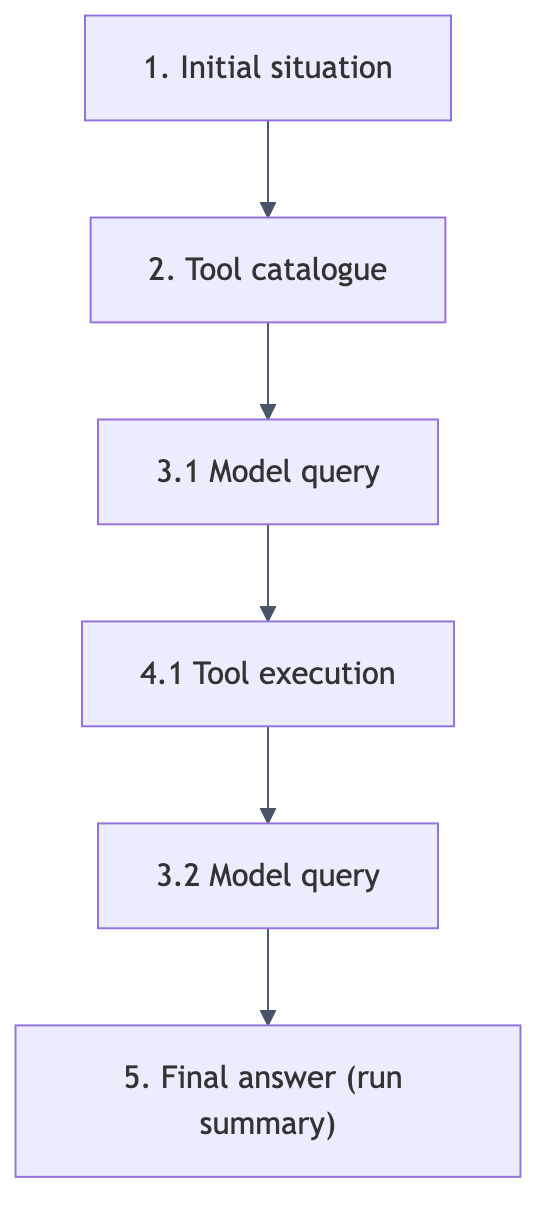
The numbering of the phases reflects this temporal order. The initial situation bears the one, the tool catalogue the two; the model queries bear the three with a sub-number per run (3.1, 3.2 …), the tool executions the four with the same sub-number (4.1, 4.2 …), and the concluding summary the five. Thus from the label of each card one can read at which point of the run it stands and how often the loop between model and tools has already been traversed.
The last card falls outside the pattern, for it shows no further phase of the protocol but a summary of the run: a few figures — the total time, the number of model runs, the number of tool calls and an estimated number of output tokens — and a small bar chart that sets the duration of the individual phases in proportion. The actual answer is not repeated by this card, for it was already rendered in the last model-query card — a circumstance the seventh chapter pursues. With the processing track the stage is thus set; the following chapter shows how the viewer brings the individual cards into being.
4. Triggering Phases Individually
The processing track does not grow of its own accord. The viewer sets the pace by triggering each phase individually — and this very interaction model is the heart of the walkthrough view. The previous chapter showed that each card receives, at its end, a button whose label names the next phase: “Fetch tool catalogue from MCP”, “Send initial model query”, “Execute the tool”, “Send follow-up model query”. A press on this button calls the corresponding method of the engine, whose result appears as a new card, which in turn carries the button to the phase after next. Thus the run proceeds step by step, each step a deliberate action.
The question of what “resumable” means in a server-side interface can be answered
precisely here. The state of the run rests, between two steps, in a field of the
view — the WalkthroughState, which the engine mutates and returns on every call. A
step takes up this state, runs its phase and deposits the result back into the
state. Between the steps nothing happens; the view remains in a clearly recognisable,
resting state and waits for the viewer’s next action.
Since the individual phases contain blocking calls to the model and to the tools,
the update model familiar from the first part applies here too: execution takes
place on a background thread, and the result is channelled into the component tree
by way of @Push and UI.access. Two flags secure the orderly course:
phaseInFlight indicates that a phase is currently running, and autoRunning
whether the viewer has chosen the automatic run.
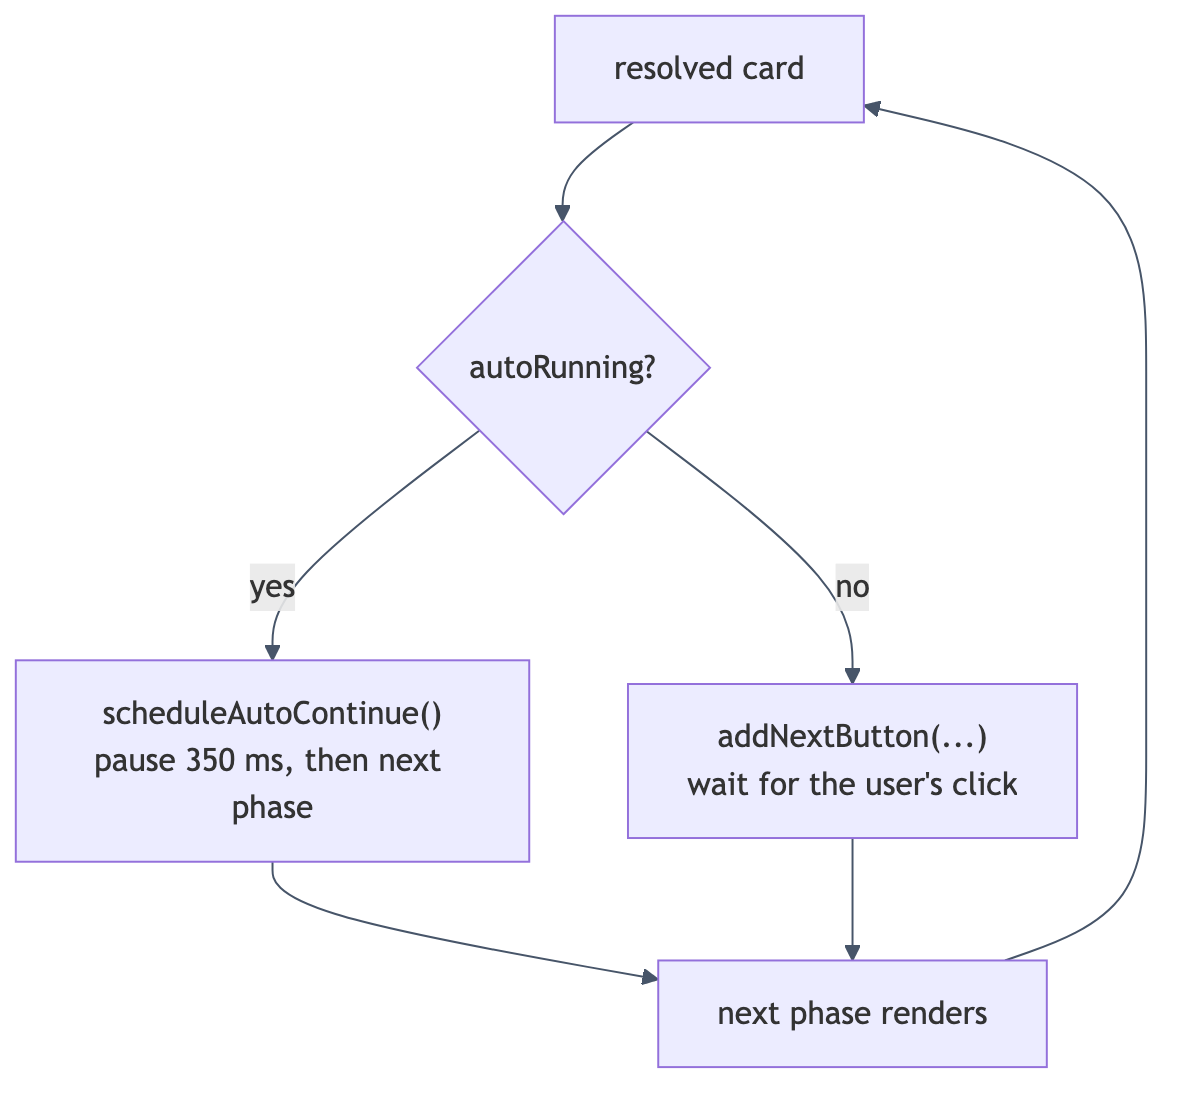
For besides stepping forward, the view offers a second way: the “Run to End” button, which traverses the remaining phases of its own accord. During such an automatic run the buttons of the individual cards are suppressed; the cards still appear as soon as their phase is resolved, but a brief pause is inserted between the phases so that the progression remains legible. This pause amounts to 350 milliseconds and is inserted by way of a dedicated virtual thread.
private void scheduleAutoContinue() {
    UI ui = UI.getCurrent();
    Thread.startVirtualThread(() -> {
        try {
            Thread.sleep(AUTO_RUN_PAUSE_MS);
        } catch (InterruptedException ie) {
            Thread.currentThread().interrupt();
            return;
        }
        try {
            ui.access(this::continueAuto);
        } catch (UIDetachedException ignored) {
        }
    });
}
The background thread sleeps the fixed pause and then triggers the next step by way
of UI.access. The try block around ui.access catches the UIDetachedException
— the case in which the viewer has meanwhile left the view; the automatic run then
runs quietly into the void instead of throwing an error. Where the automatic and the
step-by-step drives part ways is shown by the conclusion of a phase. After the tool
execution, for instance, a single branch decides whether things continue
automatically or whether the next button is offered to the viewer.
        phaseInFlight = false;
        if (autoRunning) {
            scheduleAutoContinue();
        } else {
            addNextButton(card, exec.nextActionLabel(), this::advanceToModelQuery);
            updateRunToEndAvailability();
        }
If the automatic run is chosen, the phase schedules its own continuation; otherwise the card receives a button whose label again stems from the phase record and whose activation leads to the next phase. The difference from the automatic loop of the main view is thus named precisely: it is not the mechanics of the transmission that change — they are the same in both views — but solely the trigger. In place of the self-acting continuation steps the viewer’s deliberate action.
A “Reset” button next to the input field clears the track and the recorded figures again, so that a new prompt can be entered. The viewer thus has three operating actions at his disposal: to begin a run, to carry it through step by step or of its own accord, and to reset it. Which way is chosen changes nothing about the course shown, only its pace — and precisely therein lies the didactic value: the viewer can study the same process once at leisure and once let it run in context. The following chapter turns to the second major constituent of the view, the data panel.
5. The Data Panel
Beside the processing track stands a second area to which this chapter is devoted: the data panel. While the track records the temporal succession of the phases, the data panel shows the current state of the data the model accesses — the pantry and the dietary profile. The relationship of the two areas is that of course and state: the track answers the question of how the present state came about; the data panel answers the question of what this state looks like at this moment.
Notable is what the data panel is built with. It is not a component of its own but the same sidebar that the main view already uses — here merely carried under a different name.
private final Sidebar dataPanel = new Sidebar(services.pantry(), services.profile());The reuse is no accident but the expression of the same principle that ran through the first part: the business state is maintained in exactly one place, and both views access it through the same REST clients. What was said in the first part about the writing and reloading of the sidebar holds here unchanged. The only difference lies in the role: in the main view the sidebar is the operator’s instrument; in the walkthrough view it additionally appears as an object of illustration showing what the model can read.
In the assembly of the view the data panel appears as the right half of the body, set opposite the track.
Div body = new Div(buildTrack(), dataPanel);
body.addClassName("recipe-body");
body.setSizeFull();
add(body);
The subtitle line of the view names the panel’s task expressly: “The data panel on the right reflects what the model can read; the track below grows one card per step.” With that, the interplay of the two areas is brought to the point. On the left the track grows card by card and shows the process; on the right stands the data panel and shows the object to which the process refers.
The data panel is not rigid but is refreshed in the course of the run — and indeed at the point at which the model may actually have changed the state. After the tool execution, when a state-mutating tool such as consuming an ingredient or adjusting the profile has run, the view reloads the panel.
        dataPanel.refreshGrid();
        dataPanel.refreshProfileForm();
It is here that the didactic gain of juxtaposing course and state shows itself. The viewer sees in the track that a tool was called which changes the pantry; and he sees, at the same moment, in the data panel how the pantry has thereby changed. The one explains the other: the tool execution in the track is the cause, the changed display in the data panel the effect. Where the main view performs the refresh only at the end of a whole run, here it happens after each individual tool execution — fitting to the slowed-down pace of the walkthrough, which wishes to make each effect visible on its own.
Thus track and data panel come together as two perspectives on the same process. The one shows the sequence of actions, the other their precipitation in the state. The following chapter returns to the track and considers a case that demands a presentation of its own: the simultaneous execution of several tools.
6. Presenting Parallel Tool Calls
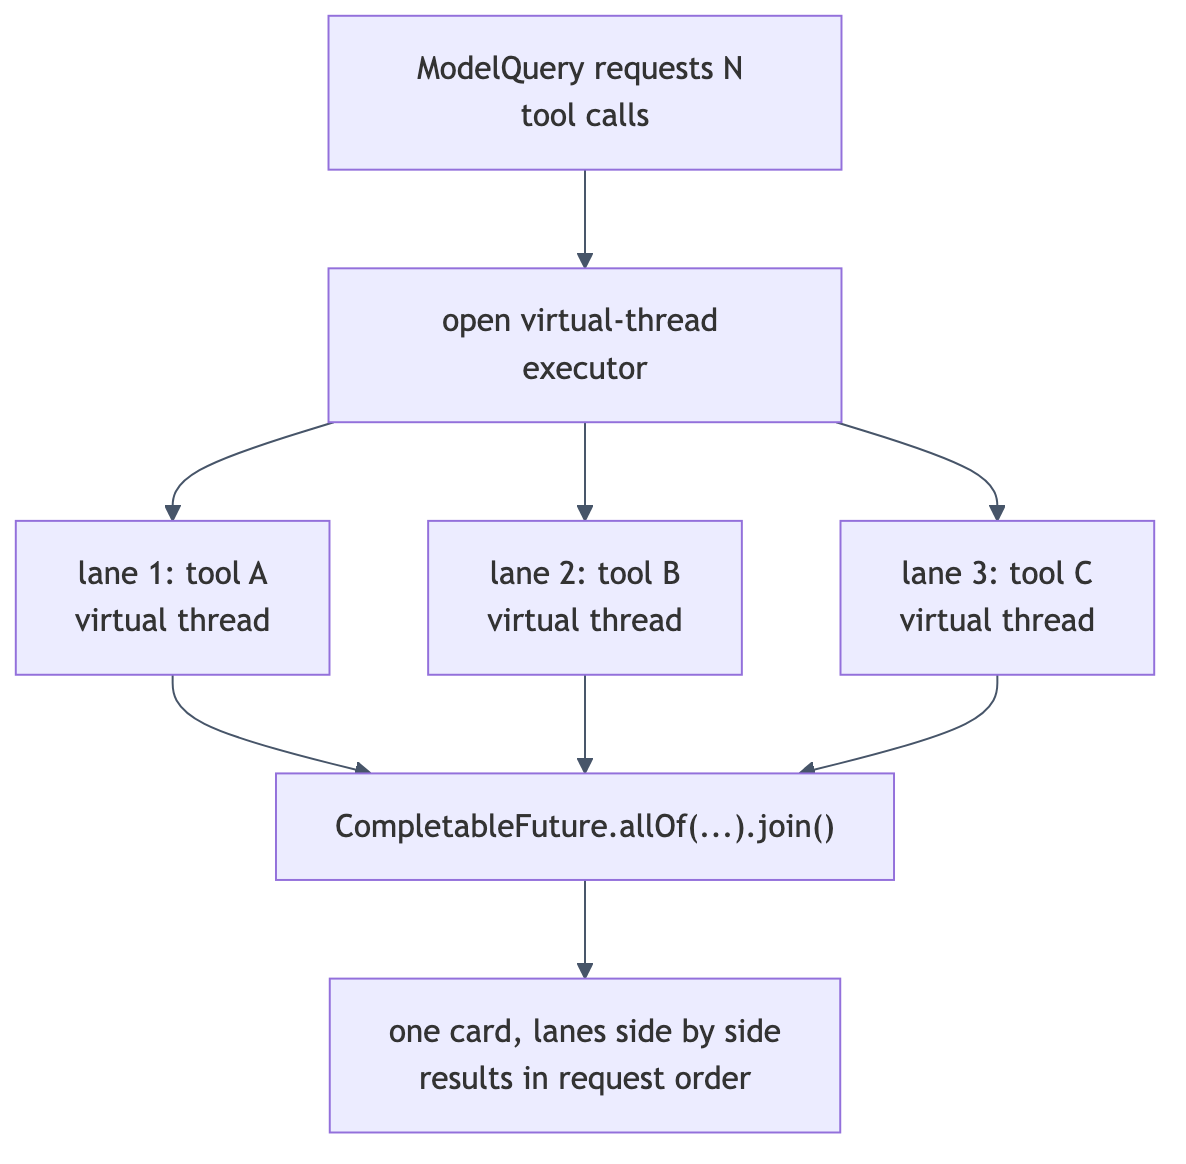
If the model requests several tools at once in a single reply, a twofold task arises: the calls are to be executed concurrently, and their simultaneity is at the same time to be presented as such. The walkthrough view solves both sides of this task in a way that directly reflects the technical reality of the engine.
The execution is taken on by the engine in its fourth phase. It opens an executor
with one virtual thread per task, submits a CompletableFuture for each tool call,
waits with allOf for their completion, and collects the results in the original
order of the request.
try (ExecutorService executor = Executors.newVirtualThreadPerTaskExecutor()) {
    List<CompletableFuture<WalkthroughPhase.ToolOutcome>> futures =
            new ArrayList<>(calls.size());
    for (WalkthroughPhase.PendingToolCall call : calls) {
        futures.add(CompletableFuture.supplyAsync(
                () -> invokeSafely(call), executor));
    }
    CompletableFuture.allOf(futures.toArray(new CompletableFuture[0])).join();

    List<WalkthroughPhase.ToolOutcome> outcomes = new ArrayList<>(calls.size());
    for (CompletableFuture<WalkthroughPhase.ToolOutcome> f : futures) {
        outcomes.add(f.join());
    }
Three properties of this execution deserve attention. First, the calls are genuinely
conducted simultaneously, each on a virtual thread of its own. Second, the results
are collected in the order of the request, not in the order of their arrival; the
presentation thereby remains stable, whichever call answers first. Third, a failed
call throws no exception but is returned through invokeSafely as an error outcome,
so that the model can react to it on the next run.
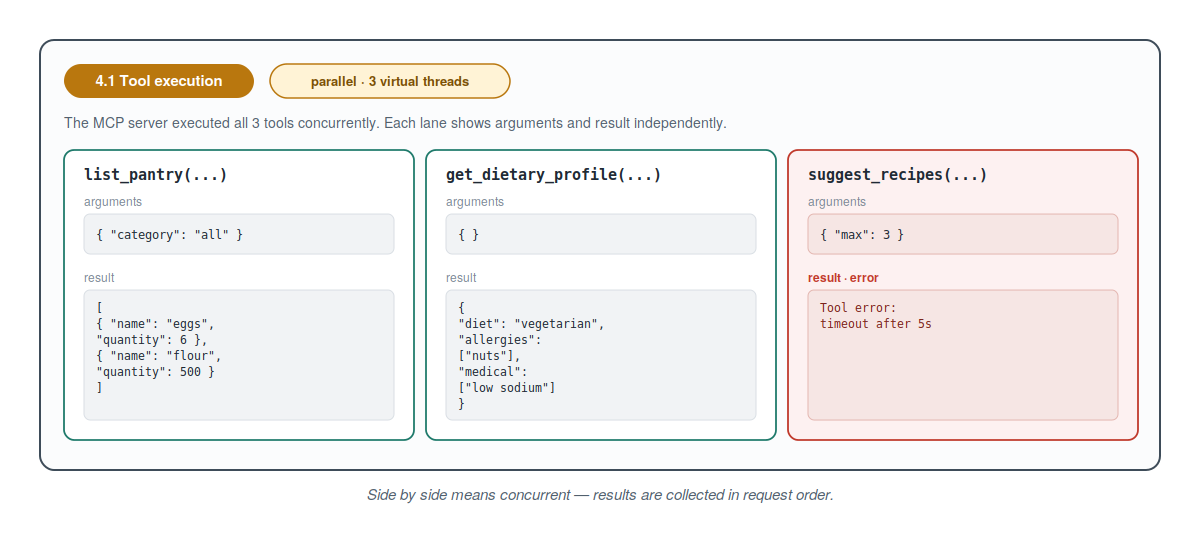
The presentation of this simultaneity rests on a deliberate decision: several calls requested at once are not shown as separate, vertically stacked cards, but as side-by-side lanes within a single tool-execution card, furnished with a parallel marker that names how many concurrent virtual threads are running. Vertically stacked cards denote, as the third chapter showed, a sequential dependency; side-by-side lanes denote simultaneity. The form of the presentation thus itself carries a statement about the concurrency.
While a call is still running, its lane shows the name of the tool, the arguments and a hint at the pending result.
private Div buildLaneRunning(WalkthroughPhase.PendingToolCall c) {
    Div lane = new Div();
    lane.addClassName("recipe-walkthrough__lane");
    lane.addClassName("recipe-walkthrough__lane--running");
    Span name = new Span(c.name() + "(...)");
    name.addClassName("recipe-walkthrough__tool-name");
    Pre args = new Pre(prettyJson(c.argumentsJson()));
    args.addClassName("recipe-walkthrough__json");
    Span pending = new Span("Awaiting MCP response...");
    pending.addClassName("recipe-walkthrough__pending");
    lane.add(name, args, pending);
    return lane;
}
Once the execution is complete, the card replaces the running lanes with the resolved ones and at the same time refreshes the data panel.
private void finishToolExecutionCard(Div card, Div description,
                                     Div result, Div lanes,
                                     Div progressWrap,
                                     WalkthroughPhase.ToolExecution exec) {
    result.remove(progressWrap);
    card.removeClassName("running");
    lanes.removeAll();
    for (WalkthroughPhase.ToolOutcome oc : exec.outcomes()) {
        lanes.add(buildLaneResolved(oc));
    }

    description.removeAll();
    description.add(makeDescriptionLabel("Description"));
    description.add(new Div(new Span(exec.description())));

    dataPanel.refreshGrid();
    dataPanel.refreshProfileForm();
Each resolved lane shows the name of the tool, the arguments and the neatly formatted result JSON; an erroneous call paints its lane red. Notably, the refresh of the data panel happens precisely here — after the execution, when the tools may have changed the state — which closes the arc to the previous chapter.
The statement of the presentation — sequential below one another, parallel beside one another — corresponds to the reality of the engine. The description of the phase record brings this to the point: “The MCP server executed all N tools concurrently (parallel virtual threads). Each lane shows arguments and result independently.”
Thus the walkthrough view makes the concurrency both effective and visible. It conducts the calls genuinely simultaneously, and it shows them in a form that does not veil this simultaneity but displays it — without thereby losing the temporal placement of the calls within the overall course, for all lanes dwell in one and the same card at its place in the track.
The following chapter returns to a detail that dwells in the model-query card and closes the arc to the first part: the streaming of the text and its final presentation as Markdown within a single card.
7. Streaming and Markdown in the Phase Card
The fifth chapter of the first part ended with a forward reference. There it was shown that the main view renders the stream directly as Markdown, and at the same time it was announced that the step-by-step view takes the opposite path: raw text first, then rendered. This counter-design the present chapter makes good on. It dwells in the model-query card, that card which represents a single call to the model.
While the stream runs, the text grows in a plain area. On assembly the card is
furnished with such a streamDiv, an indeterminate progress bar and — as a
particularity of the walkthrough view — a presentation of the request that was sent.
Then, on a virtual thread, the call to the engine runs, whose callback appends each
fragment to the raw-text area.
StringBuilder buffer = new StringBuilder();
Div header = headerRow(chip);
Div description = makeDescription();
Div result = new Div(requestSection, replyLabel, progressWrap, streamDiv);
result.addClassName("recipe-card__result");
card.add(header, subtitle, result, description);
trackContainer.add(card);

java.time.Instant t0 = java.time.Instant.now();
int iterationLabel = nextIter;
Thread.startVirtualThread(() -> {
    try {
        WalkthroughPhase.ModelQuery query = engine.runModelQuery(state,
                chunk -> ui.access(() -> {
                    buffer.append(chunk);
                    streamDiv.setText(buffer.toString());
                }));
The callback appends each fragment to the buffer and sets its content as plain text
on the streamDiv. It is setText, not the setting of Markdown content: during the
stream the answer deliberately appears as raw text. With that, the two-stage approach
announced in the first part is visible in its first stage. Notable, too, is the
presentation of the request that precedes the card: it shows exactly the messages
that were sent to the model — system and user message and, in later runs, the
preceding replies and tool results — so that the viewer recognises precisely what the
model received.
The second stage sets in as soon as the stream is complete. The card then decides, on the basis of the requested tools, how it presents itself finally.
if (query.toolCalls().isEmpty()) {
    result.remove(streamDiv);
    Markdown rendered = new Markdown(streamedText.isBlank() ? "_(no text)_" : streamedText);
    rendered.addClassName("recipe-walkthrough__rendered");
    result.add(rendered);
    phaseInFlight = false;
    // The streamed text is already rendered as Markdown here, so the
    // dedicated "final answer" card would be redundant. Skip straight
    // into the run-summary card with timing + token stats.
    if (autoRunning) {
        scheduleAutoContinue();
    } else {
        scheduleAutoSummaryAdvance();
    }
} else {
    if (streamedText.isBlank()) {
        streamDiv.setText("(no text emitted; the model went straight to tool calls)");
        streamDiv.addClassName("recipe-walkthrough__stream--empty");
    }
If the model requests no tools, this is the final answer. The card removes the
raw-text area and replaces it with a freshly created Markdown component — the second
stage of the announced two-stage approach. It is precisely because the final answer
is already rendered here that a dedicated card for the “final answer” would be
superfluous; the comment in the source says so expressly. The view therefore
proceeds directly to the summary card that the third chapter described as the last
card of the track. If, on the other hand, the model requests tools, the raw text
remains — with a hint, where applicable, should the model have gone straight to the
tool calls — and beneath it appears a listing of the requested calls.
The reason for this different choice from the main view lies, as already set out in the first part, in the different purpose. The teaching view prefers a calm, stable picture of each phase. During the stream it shows the raw text, which grows calmly without incomplete markup rearranging itself beneath the viewer’s gaze; only after completion does the rendered document take its place. The phase description confirms it: “Streaming is complete and the text is rendered as Markdown.”
With that, the arc that the first part spanned is closed. The two views answer the same design question in two well-founded ways: the main view renders progressively, to show the vividness of the emergence; the walkthrough view shows raw text first and renders after completion, to preserve the calm of study. Both ways follow the same principle, that an interface should honestly reflect the state of its content. The following chapter returns to a card that the run passed through early and that rewards a closer look: the tool-catalogue card.
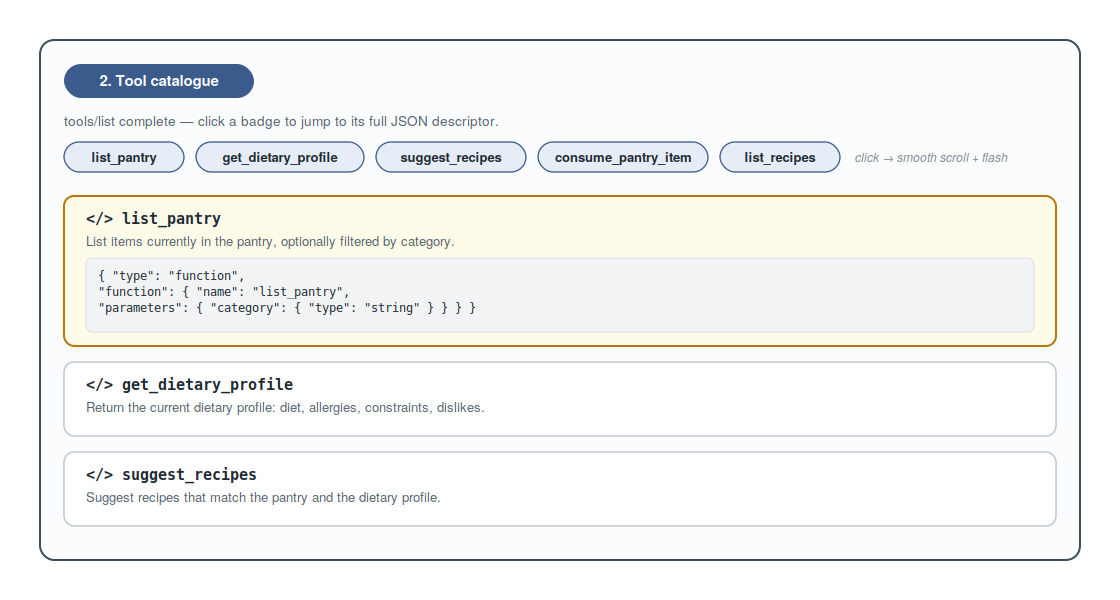
8. The Tool-Catalogue Card
At its beginning the run passes through a card that the preceding narrative left behind quickly: the tool-catalogue card, the second phase. It deserves a closer look, for it is more than a mere list. It makes visible which tools the attached server offers the model at all, and it does so in a form that surpasses mere enumeration: with clickable badges and full JSON descriptors, between which a smooth scroll mediates.
The card carries two areas: a row of badges and a sequence of entries. Each entry presents a tool in detail — with name, description and the full JSON descriptor — while the badges serve as concise, clickable jump marks. The construction of the entries arises from the tool array that the engine procured in the second phase.
java.util.Map<String, Div> entryByName = new java.util.LinkedHashMap<>();
for (JsonNode tool : phase.toolsArray()) {
    String toolName = tool.path("function").path("name").asText();
    if (toolName == null || toolName.isBlank()) continue;
    Div entry = new Div();
    entry.addClassName("recipe-walkthrough__tool-entry");
    entry.getElement().setAttribute("data-tool-name", toolName);

    Span entryTitle = new Span(new Icon(VaadinIcon.CODE), new Span(toolName));
    entryTitle.addClassName("recipe-walkthrough__tool-entry-title");

    String description = tool.path("function").path("description").asText("");
    if (!description.isBlank()) {
        Span entryDesc = new Span(description);
        entryDesc.addClassName("recipe-walkthrough__tool-entry-desc");
        entry.add(entryTitle, entryDesc);
    } else {
        entry.add(entryTitle);
    }
    Pre json = new Pre(prettyJson(tool.toString()));
    json.addClassName("recipe-walkthrough__json");
    entry.add(json);
    entries.add(entry);
    entryByName.put(toolName, entry);
}
Two things deserve attention. First, name and description are read directly from the
tool’s JSON node — via path and asText — so that the card shows exactly what the
server actually offers, not a maintained second version. Second, a LinkedHashMap
holds the mapping of tool names to entry Div and thereby preserves the order; it is
this very mapping that allows the badges to jump to their entry. The full descriptor
is attached as a monospaced Pre block.
The badges arise in a second pass, this time over the phase’s list of names. If an entry is found for a name, the badge is made clickable and furnished with the features necessary for operability and accessibility.
for (String name : phase.toolNames()) {
    Span tag = new Span(name);
    tag.addClassName("recipe-walkthrough__tool-tag");
    Div target = entryByName.get(name);
    if (target != null) {
        tag.addClassName("recipe-walkthrough__tool-tag--clickable");
        tag.getElement().setAttribute("title",
                "Jump to " + name + " descriptor");
        tag.getElement().setAttribute("role", "button");
        tag.getElement().setAttribute("tabindex", "0");
        tag.getElement().addEventListener("click",
                ev -> scrollToToolEntry(target));
        tag.getElement().addEventListener("keydown",
                ev -> scrollToToolEntry(target))
                .setFilter("event.key === 'Enter' || event.key === ' '");
    }
    tags.add(tag);
}
Here it shows how much can be regulated on the element itself with the platform’s own
means in Vaadin Flow. The badge receives, through setAttribute, the role of a
button, a tooltip and a tab index, so that it is reachable not only with the mouse but
also with the keyboard. Two listeners are attached to the element — one for the mouse
click, one for the keyboard — whereby the keyboard listener is restricted through
setFilter to the Enter and the space key. This filter is notable: it is a
client-side expression that decides already in the browser whether the event is
reported to the server at all; needless server round trips are thereby avoided.
The actual jumping is taken on by a small method that triggers client-side behaviour
through executeJs.
private void scrollToToolEntry(Div target) {
    target.getElement().executeJs(
            "this.scrollIntoView({behavior:'smooth', block:'start'});"
                    + "this.classList.add('recipe-walkthrough__tool-entry--flash');"
                    + "setTimeout(() => "
                    + "this.classList.remove('recipe-walkthrough__tool-entry--flash'),"
                    + " 1500);");
}
The passed JavaScript expression lets the target entry scroll smoothly into the
visible area and then adds to it, for a second and a half, a style class that makes it
flash briefly before it is removed again. Thus, after a click on a badge, the viewer
not only finds the corresponding descriptor again, but his gaze is led directly to it
by the flash. That this within the expression refers to the target element is the
bridge between the server-side component and its client-side counterpart.
The catalogue card thus comes together from three simple means: the reading of the real tool array, the linking of badge and entry through an ordered mapping, and a slim piece of client-side behaviour for the jumping and flashing. A charting library or an additional framework is not needed for this; the element and its methods suffice.
The following chapter turns to the last card of the run, which is likewise built by hand and uses no bought-in chart: the summary card.
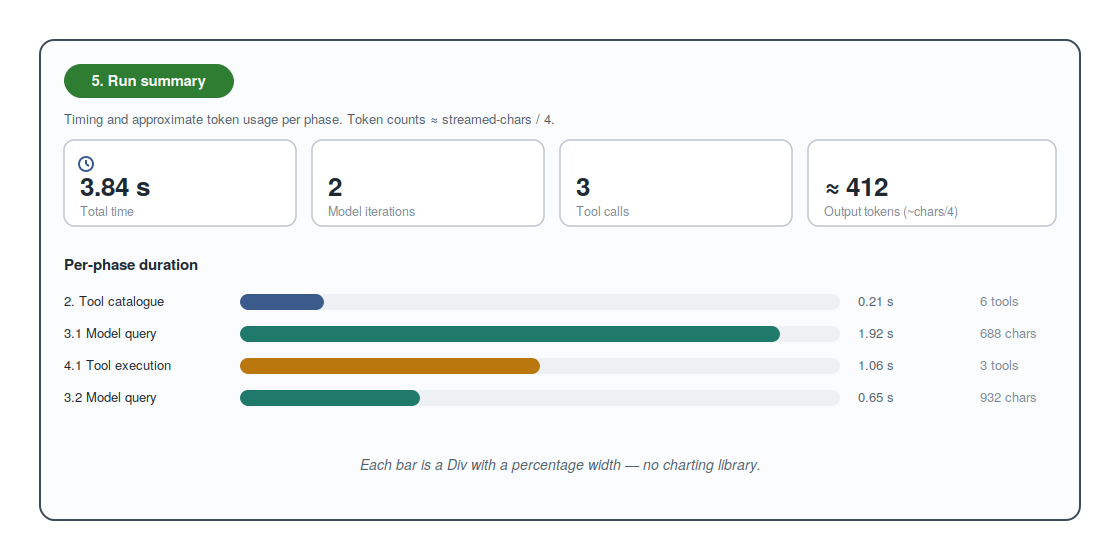
9. The Summary Card
The last card of the run shows no further phase of the protocol but a balance: a few figures and a bar chart that sets the duration of the individual phases in proportion. The third chapter already mentioned it as the conclusion of the track; here let it be considered in detail, for it is pure, hand-assembled Vaadin composition — without a charting library, solely from elementary components and proportionally set widths.
The card itself is plainly built. It strings together a row of stat tiles and a bar chart; the actual answer it does not repeat, since that was already rendered in the last model-query card.
private void renderFinalAnswerCard(WalkthroughPhase.FinalAnswer phase) {
    Div card = newCard(null, "recipe-card--final");
    Span chip = makeChip("recipe-chip--final", VaadinIcon.CHART_LINE,
            "5. Run summary");
    Div header = headerRow(chip);
    Span subtitle = makeSubtitle(
            "Timing and approximate token usage per phase. Token counts are "
                    + "estimated as streamed-chars / 4.");

    Div result = new Div();
    result.addClassName("recipe-card__result");
    result.add(buildSummaryTiles(phase));
    result.add(buildPhaseChart());

    Div description = makeDescriptionBlock(phase.description());
    card.add(header, subtitle, result, description);
    trackContainer.add(card);
}
The figures arise from the statistics captured phase by phase during the run. Each
completed phase has left behind a PhaseStat record — with label, colour class,
duration and a size figure together with a unit, for instance the number of tools or
the character count of the stream. From these values the card sums the total duration,
the number of tool calls and the total of streamed characters.
private Div buildSummaryTiles(WalkthroughPhase.FinalAnswer phase) {
    long totalChars = 0;
    long totalDurationMs = 0;
    int toolCalls = 0;
    for (PhaseStat s : phaseStats) {
        totalDurationMs += s.duration().toMillis();
        if ("chars".equals(s.sizeLabel())) totalChars += s.sizeValue();
        if ("tool".equals(s.sizeLabel()) || "tools".equals(s.sizeLabel())) {
            toolCalls += (int) s.sizeValue();
        }
    }
    long wallClockMs = runStartedAt == null ? totalDurationMs
            : java.time.Duration.between(runStartedAt, java.time.Instant.now()).toMillis();
    long approxTokens = totalChars / 4;

    Div tiles = new Div();
    tiles.addClassName("recipe-walkthrough__summary-tiles");
    tiles.add(buildTile(VaadinIcon.CLOCK,
            formatMillis(wallClockMs), "Total time"));
    tiles.add(buildTile(VaadinIcon.REFRESH,
            Integer.toString(phase.iterations()), "Model iterations"));
    tiles.add(buildTile(VaadinIcon.COGS,
            Integer.toString(toolCalls), "Tool calls"));
    tiles.add(buildTile(VaadinIcon.FILE_TEXT_O,
            "≈ " + approxTokens, "Output tokens (~chars/4)"));
    return tiles;
}
Two subtleties deserve attention. The total duration, when the start instant is known, is measured as the actually elapsed wall-clock time between beginning and present, not as a mere sum of the phase durations; pauses between the steps thus enter the reported total time. And the number of output tokens is not measured but estimated from the character count — as character count divided by four — which is why the tile carries the approximately sign. It is a deliberately coarse approximation that gives the viewer an order of magnitude without promising more than it can hold.
Each individual tile is a small, ever-identical building block of icon, value and label.
private Div buildTile(VaadinIcon icon, String value, String label) {
    Div tile = new Div();
    tile.addClassName("recipe-walkthrough__tile");
    Icon i = new Icon(icon);
    i.addClassName("recipe-walkthrough__tile-icon");
    Span valueSpan = new Span(value);
    valueSpan.addClassName("recipe-walkthrough__tile-value");
    Span labelSpan = new Span(label);
    labelSpan.addClassName("recipe-walkthrough__tile-label");
    tile.add(i, valueSpan, labelSpan);
    return tile;
}
The bar chart is the most instructive part of the card, for it shows how a usable chart can be drawn without any charting library, solely with the means of the platform. First the largest duration value is determined, which serves as the reference magnitude for the scaling; then each phase receives a row.
private Div buildPhaseChart() {
    Div chart = new Div();
    chart.addClassName("recipe-walkthrough__chart");

    Span chartTitle = makeSectionLabel(VaadinIcon.BAR_CHART_H,
            "Per-phase duration");
    chart.add(chartTitle);

    long maxMs = 1;
    for (PhaseStat s : phaseStats) {
        maxMs = Math.max(maxMs, s.duration().toMillis());
    }
    for (PhaseStat s : phaseStats) {
        chart.add(buildChartRow(s, maxMs));
    }
    return chart;
}
The core lies in the individual row. From the duration of the phase and the previously determined maximum a percentage is calculated which is set directly as the width of the bar. A lower bound of two per cent ensures that even very short phases appear as a visible bar and do not vanish entirely.
private Div buildChartRow(PhaseStat s, long maxMs) {
    Div row = new Div();
    row.addClassName("recipe-walkthrough__chart-row");

    Span label = new Span(s.label());
    label.addClassName("recipe-walkthrough__chart-label");

    long ms = s.duration().toMillis();
    double pct = Math.max(2.0, (ms * 100.0) / maxMs);
    Div barTrack = new Div();
    barTrack.addClassName("recipe-walkthrough__chart-track");
    Div bar = new Div();
    bar.addClassName("recipe-walkthrough__chart-bar");
    bar.addClassName("recipe-walkthrough__chart-bar--" + s.colorClass());
    bar.getStyle().set("width", String.format(java.util.Locale.ROOT,
            "%.1f%%", pct));
    barTrack.add(bar);

    Span duration = new Span(formatMillis(ms));
    duration.addClassName("recipe-walkthrough__chart-duration");

    Span size = new Span(s.sizeValue() + " " + s.sizeLabel());
    size.addClassName("recipe-walkthrough__chart-size");

    row.add(label, barTrack, duration, size);
    return row;
}
The width of the bar is set directly on the element through getStyle().set("width", …) as a percentage; the colour stems from a style class whose name is formed from the
colour class of the phase, so that the bars match the badges of the phases by colour.
Beside the bar the row shows the duration and the size figure. The duration is
formatted legibly: below a second in milliseconds, above it in seconds with two
decimal places.
private static String formatMillis(long ms) {
    if (ms < 1000) return ms + " ms";
    return String.format(java.util.Locale.ROOT, "%.2f s", ms / 1000.0);
}
Thus from a few building blocks a complete little chart arises: a reference magnitude,
a row per phase, a bar set proportionally in its width and a readable label. Notable is
all that was not needed here — no charting library, no drawing on a canvas, no
additional framework. A Div given a percentage width is already a bar; no more is
required.
With that, the two cards that the run passed through quickly or reached last have also been considered. The following and final chapter draws the sum and brings both parts of the series together.
10. Conclusion
The first part of this series showed that the attached server makes a difference; the second has shown how that difference comes about. With that, the arc spanned by the introduction to the first part is closed — the passage from the what to the how. The step-by-step view halts what the main view reels off in one go and turns the fleeting course into a legible object.
The load-bearing insight of this part was architectural in nature: both views rest on
the same engine. The protocol logic lives in a single place, in the
WalkthroughEngine, whose five phases are realised as individually callable methods.
It is precisely this decomposition into resumable phases that guarantees the
slowed-down walkthrough shows not an imitation but the same course that the main view
traverses of its own accord. On this foundation stood the remaining chapters: the
processing track, which preserves the process card by card as a timeline; the
individual triggering of the phases, which leaves the pace to the viewer; the data
panel, which sets the state beside the course; the presentation of parallel tool
calls, whose form itself displays the concurrency; the streaming with a final
Markdown rendering in the phase card, which made good on the counter-design announced
in the first part; the tool-catalogue card, which assigns clickable badges and full
JSON descriptors to the tools offered to the model; and finally the summary card,
which concludes the run in figures and a hand-drawn bar chart.
However different the two views are in their effect, they are connected by the same principle that already ran through the first part. An interface for model-driven tool use must not merely display results; it must keep the process of their emergence comprehensible. The main view fulfils this principle through juxtaposition and simultaneity; the walkthrough view fulfils it through halting and decomposition. Both are different answers to the same demand, and precisely their difference shows that the demand admits of more than one realisation.
There remains the retrospect on the series as a whole. It began with an MCP server built using nothing but the platform’s own means, without Spring and without Jakarta EE. It continued with an interface that preserved the same renunciation of heavyweight frameworks and confined itself to Vaadin Flow with embedded Jetty. And it concluded with two views on the same process, which show that the value of an attached server cannot merely be asserted but can be demonstrated — once as a result, once as a process. Whoever has followed the series from beginning to end thus possesses not only a runnable demonstrator but an understanding of why a carefully conducted interface is indispensable for conveying model-driven tool use.


